
Understanding the 6 Most Common Types of Data for Analysis
Understanding the various types of data is crucial in statistical analysis The six most commonly used are nominal, categorical, ordinal, dichotomous, continuous, and discrete data Each type has its own unique characteristics and uses Knowing how to analyze and interpret these types of data is essential in making informed decisions
Understanding the various types of data is crucial in the field of statistics. With this knowledge, one can apply the appropriate statistical measurements to their data and draw accurate conclusions. It is important to note that statistical methods vary depending on the type of data being analyzed. Failure to recognize these differences can result in incorrect conclusions. Therefore, being well-versed in the different types of data allows for the selection of an accurate analysis technique.
A crucial prerequisite for conducting Exploratory Data Analysis (EDA) is to possess knowledge of various data types. This is essential since different statistical measurements can only be employed for specific data types. Furthermore, being familiar with the data type is necessary to determine the appropriate visualization technique. In the following sections, we will gain insights into the various types of data.
1) Nominal Data :

Nominal data is used to tag variables representing discrete units without any quantitative value. Unlike ordinal data, nominal data does not follow any specific order, meaning that the change in the arrangement of its values does not affect its significance. Any data that represents more than two categories falls under nominal data.
2) Categorical Data :
Categorical data is commonly used to represent certain characteristics such as language, citizenship, and gender. While numerical values can also be assigned to categorical data, it's important to note that these values don't hold any mathematical significance. For example, a physical disability may be represented by the value of 1, while being physically fit may be represented by 0.
Ordinal data is a unique combination of Nominal and Categorical data, featuring both ordered and discrete values. However, one drawback of this type of data is that it cannot accurately convey the difference between values. As a result, ordinal data is often used to measure non-numeric factors such as customer satisfaction, happiness, and joy.
4) Dichotomous Data :
Dichotomous data, which uses binary values of 1 and 0 to represent information, is commonly used in meta-analysis studies. However, this type of data is limited to representing only information with two values. Nominal data is more appropriate for representing data with more than two units. For instance, when asking about gender, dichotomous data would use the categories Male/Female to represent the two options.
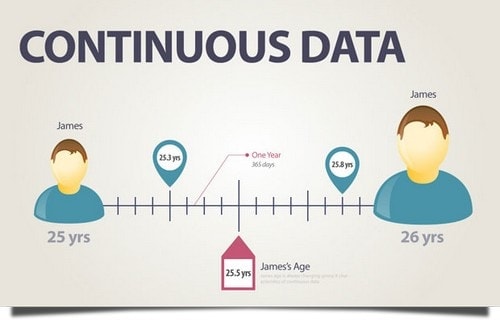
Continuous data is a type of data that represents measurements and cannot be counted. Instead, it can only be measured using intervals on a real number line. For instance, the height of a person is an example of continuous data. There are two types of continuous data.
a) Interval data :
Interval data is used to measure variables that have numerical values that are ordered and have the same difference between them. An example of this type of data is temperature, where the exact difference between the values can be determined.
Interval data presents a limitation in that it lacks a "true zero" value, meaning that in our temperature example, there is no absence of temperature. As a result, interval data cannot be multiplied or divided and ratios cannot be calculated. This lack of a true zero also hinders the application of many inferential and descriptive statistics.
b) Ratio Data :
6) Discrete data :
When dealing with data that represents ordered units with the same difference, ratio values are ideal. They differ from interval values in that they possess a true zero. This makes them perfect for measuring weight, height, length, and other similar metrics.
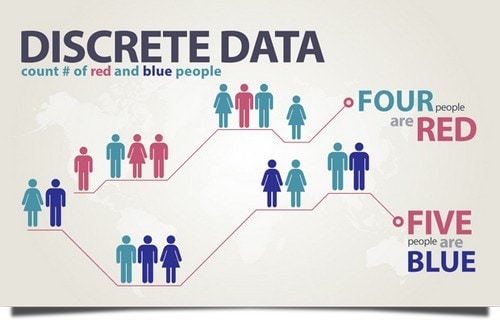
Discrete data is a representation of values that are distinct and separate from each other. While it has the limitation of only representing certain types of values, it can still be useful in categorizing information into classifications. However, it's important to note that discrete data cannot be calculated or counted, only measured.
In order to determine the probability of getting heads when flipping a coin 100 times, it is important to first determine whether the data is discrete or not. This can be achieved by asking a straightforward question of whether the outcomes of the experiment can be counted or not. If the answer is no, then it is likely that you are dealing with discrete data.