What is a Decision Flow Diagram? Types, Advantages, and Differences Explained
A decision flow diagram is a visual representation of the decision-making process It helps to understand how decisions are made, streamline decision-making and make better decisions There are different types of decision flow diagrams such as decision trees and decision tables Creating a decision flow diagram involves defining the decision-making process, creating the diagram, analyzing outcomes, making a decision, and evaluating it
A graphical representation of the decision-making process, a decision flow diagram displays the various decision paths that can be taken and their possible outcomes. This tool is beneficial not only for decision-makers but also for those who need to comprehend the decision-making process. There are various types of decision flow diagrams, including decision trees and decision tables. Decision trees depict the decision-making process as a tree, with the different decision options branching off from the primary trunk. Decision tables, on the other hand, illustrate the decision-making process as a table, with the various decision options listed in rows and columns.
What is a Decision Flow Diagram?
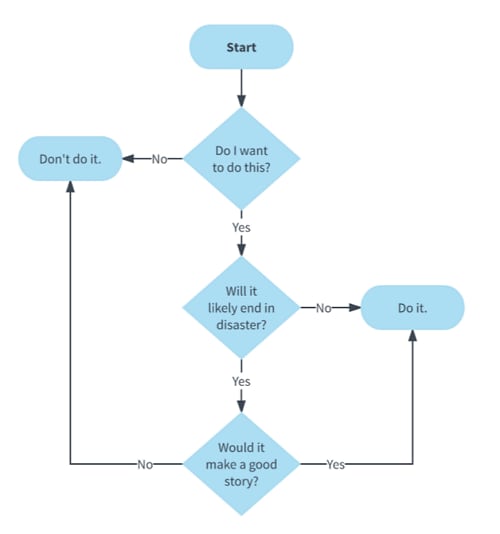
A decision flow diagram, also known as a decision tree or decision table, is a simple diagram that outlines all possible outcomes of a series of associated choices. It is used to weigh different possible actions that could be taken, making it an easy-to-understand tool for decision-making processes.
Decision flow diagrams serve as a valuable tool for mapping out various decision paths and evaluating the potential outcomes of each option to arrive at the optimal choice. These diagrams enable a deeper understanding of the decision-making process, identification of key decision-makers, and enhancement of decision-making procedures.
Why Use Decision Flow Diagram?
Why mechanical engineers use them:
- To identify all possible solutions to a problem
- To evaluate the pros and cons of each solution
- To determine the best solution based on a set of criteria or constraints
- To communicate the decision-making process to others involved in the project
- To ensure that all factors have been considered before making a final decision
Overall, decision flow diagrams are a powerful tool for mechanical engineers who need to make informed decisions based on a complex set of variables. By breaking down the decision-making process into manageable steps, engineers can ensure that they are considering all possible options and selecting the best solution for the task at hand.
1. To understand how decisions are made
Decision flow diagrams are a valuable tool for gaining insight into the decision-making process. These diagrams allow you to visualize how and why decisions are made, enabling you to better understand the decision-making process. By identifying the decision-makers involved in the process, you can gain a greater understanding of why certain decisions are made.
2. To improve decision-making
Improving the decision-making process involves identifying its weak spots and taking measures to enhance its efficiency. This can lead to a reduction in decision-making errors and an increase in transparency, ultimately resulting in better outcomes.
3. To streamline decision-making
Decision flow diagrams can help you to streamline decision-making by identifying unnecessary steps and decision points. This can lead to faster, more efficient decision-making.
4. To make better decisions
Making informed decisions can be challenging, especially when you are faced with a multitude of potential outcomes. However, decision flow diagrams offer a solution to this problem by providing a visual representation of all possible outcomes before a decision is made. By taking the time to consider each potential outcome, decision-makers can make more informed choices that lead to better results.
Types of Decision Flow Diagrams
The two popular decision flow diagram types are
1. Decision Trees
A decision tree is a visual tool used to illustrate the decision-making process. It displays various decision options as branches stemming from the main trunk, with each branch representing a different decision path. The leaves of the tree depict the potential outcomes of each decision.
2. Decision Tables
When it comes to decision-making, a decision table can be a helpful tool. It presents the different options as rows and columns in a table, with the decision paths shown in the rows and the possible outcomes displayed in the columns. This graphical representation can make complex decision-making processes easier to understand and navigate.
Decision Flow Diagram vs Decision Flowcharts
Business process modeling involves utilizing different tools and techniques to map out the steps involved. Among the most commonly used methods are decision flow diagrams and flow charts. These tools are useful in visualizing a process, but they differ in several ways.
When navigating a process, decision flow diagrams can be helpful in outlining the decisions that need to be made and the resulting actions. These diagrams consist of if/then statements that dictate the next steps. On the other hand, flow charts are used to visually represent the entire process from start to finish. By incorporating decision flow diagrams into a detailed flowchart, a more comprehensive understanding of the decision-making process can be achieved. Additionally, a cross-functional flowchart can aid in identifying areas for improvement and implementing necessary changes.
When deciding which mapping tool to use, it is crucial to determine the purpose of the map. If your goal is to outline a process from beginning to end, a flow chart may be the more suitable choice. However, if you need to visualize a decision-making process, a decision flow diagram can prove to be an invaluable resource.
How to Create a Decision Flow Diagram?
Creating a decision flow diagram is relatively simple. Here are the steps you need to follow
1. Define the decision-making process
The first step is to define the decision-making process that you want to map out. This can be done by identifying all of the decision points and possible decision options.
2. Create a decision tree
Once you have defined the decision-making process, you can create a decision tree by drawing a trunk and branches for each decision point and decision option.
3. Create a decision table
Once you have defined the decision-making process, you can create a decision table by creating rows and columns for each decision point and decision option.
4. Analyze the outcomes
Once you have created your decision flow diagrams, you can then analyze the possible outcomes of each decision in order to make the best possible choice.
5. Make a decision
After you have analyzed the possible outcomes of each decision, you can then make a decision based on the information you have gathered.
6. Evaluate the decision
After making a decision, it's important to assess whether it was the correct choice. The best way to do this is by analyzing the outcomes of the decision and comparing them to what you had originally expected.
7. Improving decision making
In the event that you are dissatisfied with a decision, it is possible to enhance the decision making process by pinpointing areas where improvements can be implemented. This can be achieved by scrutinizing decision flow diagrams and identifying opportunities for streamlining or enhancing the decision making process.
Decision Process Flowchart Symbols
To create a comprehensive decision flowchart diagram, it is essential to have knowledge of several decision flow diagram symbols. Some of the critical symbols for decision process flow chart include:
1. Decision Point
A decision point is represented by a diamond shape. This symbol is used to represent a point in the decision making process where a decision needs to be made.
2. Decision Option
A decision option is represented by a rectangle. This symbol is used to represent one of the possible decision options that can be chosen at a decision point.
3. Outcome
An outcome is represented by an oval. This symbol is used to represent the result of a decision.
4. Connector
A connector is represented by a line. This symbol is used to connect different decision flow diagram symbols together.
Now that you know the different decision process chart symbols, you are ready to create your own decision flow diagrams.
Creating a Decision Flow Diagram
Creating decision flow diagrams can be done through various software programs, or even through the traditional method of using pen and paper. These diagrams serve as a useful tool in problem-solving by visually representing the various decisions that need to be made and the order in which they should be processed, often indicated by arrows connecting possible solutions.
To create a decision flow diagram by hand, follow these steps:
Draw a diamond shape to represent the first decision point.
Draw a rectangle to represent each decision option.
Draw an oval to represent each outcome.
Connect the decision point to each decision option with a line.
Connect each decision option to the corresponding outcome with a line.
Repeat steps 1-5 for each decision point and decision option.
Creating a Decision Flow Diagram in Excel
You can also create decision flow diagrams in Excel by using the shapes tool. To create a decision flow diagram in Excel, follow these steps:
Open Microsoft Excel.
Click on the Insert tab.
In the Illustrations group, click on Shapes.
Select the shape you want to use from the drop-down menu.
Draw the shape on your worksheet.
Repeat steps 4-5 for each decision point and decision option.
Connect the decision points and decision options with lines.
Creating a Decision Flow Diagram in PowerPoint
You can also create decision flow diagrams in PowerPoint by using the shapes tool. To create a decision flow diagram in PowerPoint, follow these steps:
Open Microsoft PowerPoint.
Click on the Insert tab.
In the Images group, click on Shapes.
Select the shape you want to use from the drop-down menu.
Draw the shape on your slide.
Repeat steps 4-5 for each decision point and decision option.
Connect the decision points and decision options with lines.
Creating a Decision Flow Diagram in Visio
Microsoft Visio is a software program that you can use to create decision flow diagrams. To create a decision flow diagram in Visio, follow these steps:
Open Microsoft Visio.
Click on the File menu.
Click on New.
Select the Basic Flowchart template from the list of templates.
Click on Create.
Drag and drop the shapes you want to use onto your drawing page.
Connect the decision points and decision options with lines.
Save your decision flow diagram as a Visio file (.vsd).
Advantages of Decision Flow Diagrams

There are several advantages of decision flow diagrams, which include
Using decision flow diagrams as a visual aid can simplify the understanding of complex decision-making processes, making it easier to communicate with others. By identifying decision points and options, decision flow diagrams can also aid in the optimization of decision-making processes.
Decision flow diagrams can help you to identify the possible outcomes of a decision. This can be helpful when you are trying to make a decision.
Disadvantages of Decision Flow Diagrams
There are also some disadvantages of decision flow diagrams, which include
Decision flow diagrams can be time-consuming to create.
Decision flow diagrams can be difficult to understand if they are not well-designed.
Decision flow diagrams may not be necessary for all decision processes.
Decision trees in machine learning and data mining
Decision trees have become a widely used method in machine learning and data mining to classify instances. This tool is designed to support decision-making processes that involve a tree-like model of decisions, which includes the potential consequences, resource costs, and utility of each decision. Decision trees are part of a larger family of decision support methods known as decision analysis, which are particularly useful in complex and uncertain situations.
The ability to handle both categorical and continuous data, the ability to handle missing data, and the ability to interpret and visualize the results. Additionally, decision trees are easy to understand and can be used for both classification and regression tasks. However, decision trees can be prone to overfitting, and the quality of the results can be highly dependent on the quality of the training data.
Easy to understand and interpret.
Can be used for both classification and regression tasks.
Can handle both categorical and numerical data.
Robust to noisy data.
Able to handle missing values.
Disadvantages of decision trees include:
Can be overfitted if the training data is not representative of the test data.
Can be unstable because small changes in the data can result in large changes in the tree.
Decision tree models are often biased if the classes are imbalanced (i.e., there are more instances of one class than another).
Can be difficult to explain to non-technical audiences.
When to use decision trees?
When dealing with classification and regression tasks that involve noisy data or missing values, decision trees are a reliable option. Moreover, decision trees are highly recommended if you aim to construct a model that is straightforward to interpret and communicate to others.
If you encounter an imbalanced dataset where one class has significantly more instances than the other, it's important to be mindful of potential biases that may arise when using decision trees. A possible alternative approach would be to consider other machine learning algorithms like support vector machines or random forests.
Conclusion
Decision flow diagrams can certainly be a helpful tool for decision making, but it is important to weigh their advantages and disadvantages before implementing them. While they can improve the decision making process by clarifying options and decision points, it is worth noting that they can be time-consuming to create. Additionally, it may be beneficial to consider other tools, such as mind maps, for generating ideas and creative solutions. In the realm of machine learning and data mining, decision trees are a popular classification method due to their ease of interpretation. Ultimately, the decision to use decision flow diagrams should be based on the specific needs and circumstances of each situation. What are your thoughts on the best applications for decision flow diagrams? Share your insights in the comments below.