The Ultimate Windows Task Manager Guide: Mastering the Art of Performance Optimization
Discover the ultimate guide to Windows Task Manager! Uncover all the features and technical terms in Windows 10's Task Manager in this comprehensive 5500+ word article From launching the Task Manager to managing processes, controlling startup applications, and exploring Process Explorer, this guide has got you covered!
Key Takeaways
The Windows Task Manager provides valuable information about system resource usage and process statistics.
The Task Manager has a simple view and a more advanced tabbed interface.
The Task Manager can be used to manage running processes and enable or disable startup processes.
The Windows Task Manager is a robust tool that provides valuable information about your system's resource usage and detailed statistics of each process. This comprehensive guide elucidates every feature and technical term in the Task Manager.
Although this article primarily concentrates on Windows 10's Task Manager, many aspects discussed here are also applicable to Windows 11 and Windows 7. It is worth noting that the changes in Windows 11 Task Manager are primarily superficial, resulting in minor visual differences.
How to Launch the Task Manager

There are multiple methods available in Windows to open the Task Manager. You can quickly access it by pressing Ctrl+Shift+Esc on your keyboard or by right-clicking the Windows taskbar and choosing "Task Manager."
Alternatively, you can use the Ctrl+Alt+Delete key combination and then select "Task Manager" from the displayed screen. Another option is to locate the Task Manager shortcut in your Start menu.
Task Manager's Simple View
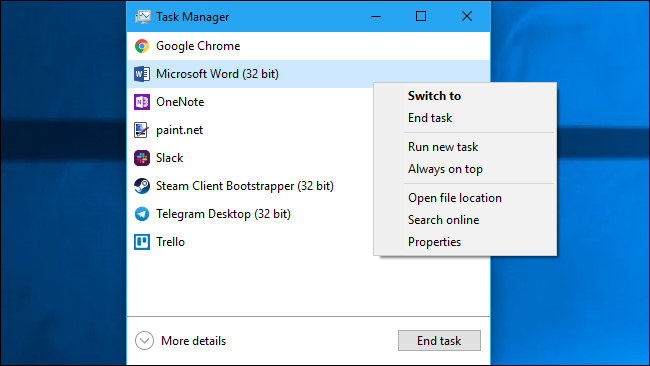
Switch to: Activate the application window, placing it at the forefront of your desktop and giving it focus. This feature is particularly useful when you are uncertain about the association between windows and applications.
End Task: Terminate the process. This function operates identically to the "End Task" button.
Open the Create New Task window to specify a program, folder, document, or website address for Windows to open.
Enable "always on top" for the Task Manager window, ensuring it remains visible above all other windows on your desktop.
Open File Location: Open a File Explorer window to view the directory where the program's .exe file is stored.
Search Online: Conduct a Bing search using the program's application name and file name to gain comprehensive information about its purpose and functionality.
Properties: Open the Properties window for the program's .exe file. Here you can tweak compatibility options and see the program's version number, for example.

When the Task Manager is active, a corresponding icon will appear in your notification area. This icon displays the current utilization of your system's CPU resources, and hovering over it will reveal information about memory, disk, and network usage. This provides a convenient method of monitoring your computer's CPU usage.
To view the system tray icon without the Task Manager appearing on your taskbar, navigate to Options > Hide When Minimized in the complete Task Manager interface and then minimize the Task Manager window.
The Task Manager's Tabs Explained
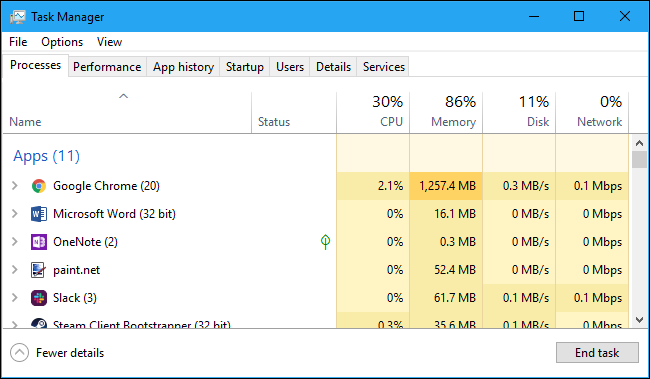
Click "More Details" at the bottom of the simple view window to access the Task Manager's advanced tools. This will display the full tabbed interface. The Task Manager will retain your preference and open in the advanced view next time. To switch back to the simple view, click "Fewer Details."
The tabs available in the Task Manager's More Details view are as follows:
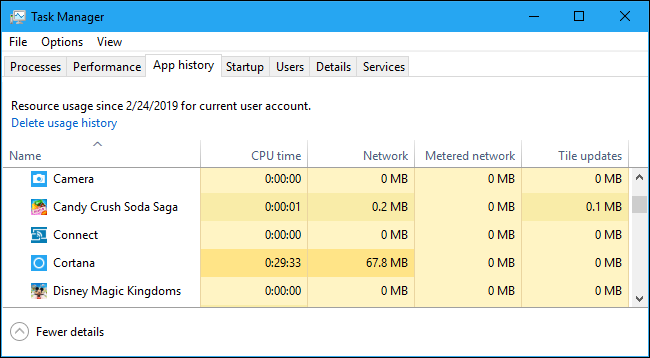
App History: Details regarding the utilization of CPU and network resources by apps on your current user account are provided. This pertains solely to new Universal Windows Platform (UWP) apps, commonly known as Store apps, and excludes traditional Windows desktop apps (Win32 applications).
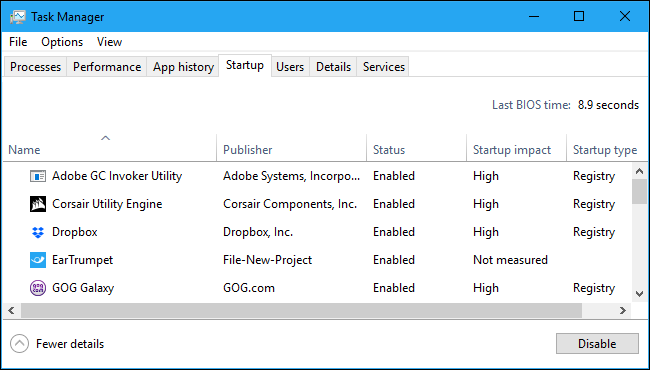
Startup: A compilation of your startup programs, referring to the applications that Windows initiates automatically upon signing into your user account. It is possible to deactivate startup programs through this section, although the same can also be achieved via Settings > Apps > Startup.
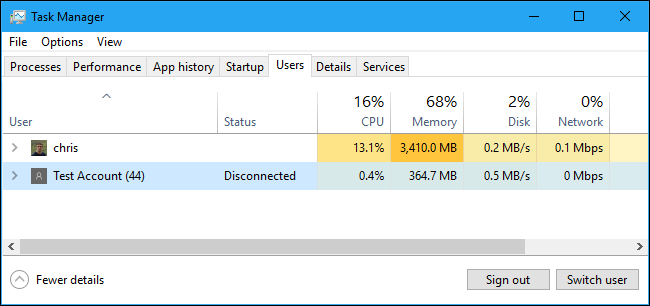
Users: View information about the user accounts currently logged into your computer, including their resource usage and the applications they are running.
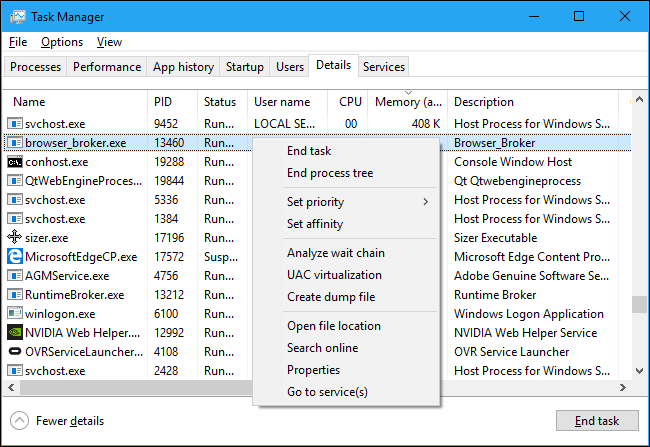
Details: Access more comprehensive data on the processes that are currently running on your system. This section resembles the conventional "Processes" tab found in the Task Manager on Windows 7.
Services: Management of system services. This is the same information you'll find in services.msc, the Services management console.
Managing Processes with the Task Manager
The Processes tab provides a comprehensive overview of all the processes currently active on your system. When sorted by name, the list is divided into three categories. The Apps category displays the same list of running applications as seen in the simplified "Fewer details" view. The remaining two categories, background processes and Windows processes, showcase additional processes that are not visible in the standard simplified Task Manager interface.
For instance, applications such as Dropbox, your antivirus software, background update processes, and hardware utilities featuring notification area (system tray) icons are listed under background processes. Windows processes encompass a variety of tasks that pertain to the Windows operating system, although a few of them show up in the "Background processes" section for unknown reasons.
The actions you can perform on a process can be accessed by right-clicking it. The context menu offers the following options:
1. Expand: For certain applications such as Google Chrome, multiple processes are grouped together. In other cases, there may be multiple windows belonging to one process. To view all individual processes within a group, you can choose to expand by either double-clicking on the process or clicking the arrow located to its left. This option is only available when you right-click on a group.
Content must be rewritten in a better way:
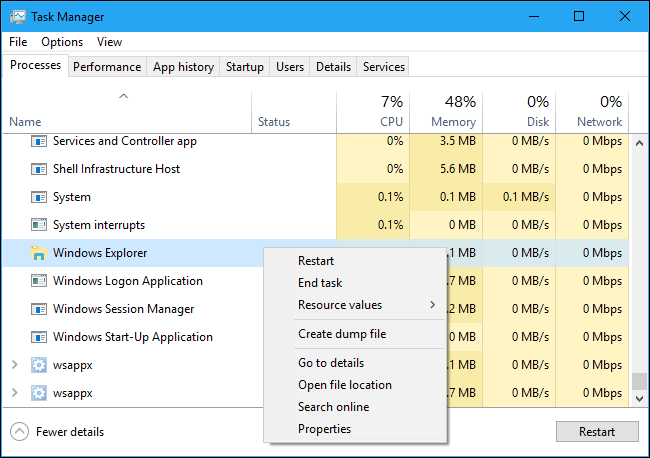
Restart: This option is available when you right-click on Windows Explorer. It allows you to restart explorer.exe instead of only terminating the task. In previous versions of Windows, you had to end the Explorer.exe task and manually relaunch it to resolve issues with the Windows desktop, taskbar, or Start menu. Now, you can simply use the Restart option.
Resource values: This feature enables you to select whether you prefer to view memory, disk, and network values as percentages or precise measurements. In other words, you can choose whether you want to see the exact amount of memory in MB or the percentage of memory utilized by applications on your system.
- Dump File Creation: This tool is used by programmers for debugging purposes. It enables the capture of a memory snapshot of the program, which is then saved onto the disk.
- Accessing Details: Navigate to the process located on the Details tab to gain access to more comprehensive technical information.
Open file location: Open File Explorer with the process's .exe file selected.
Search online: Search for the name of the process on Bing.
To access the Properties window of the .exe file linked to the process, follow these steps. However, exercise caution before ending any tasks, as some of them are crucial background processes for Windows. These tasks often have obscure names, so it may be necessary to conduct a web search to determine their purpose. We have an extensive series that comprehensively explains the functionalities of different processes, ranging from conhost.exe to wsappx.
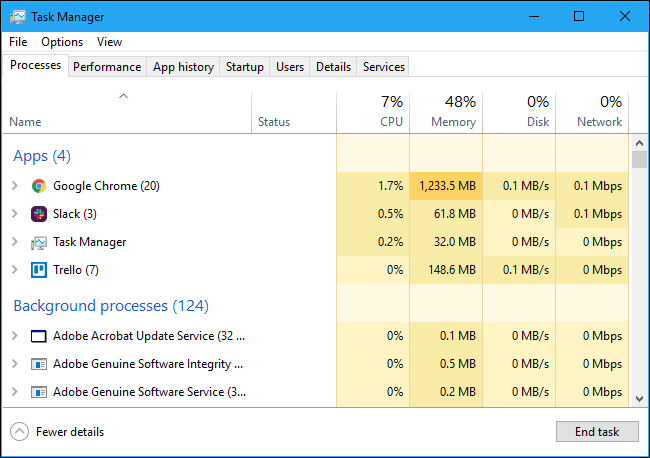
Additionally, this tab provides comprehensive data on individual processes as well as their cumulative resource consumption. By right-clicking on the headers located at the top of the list, you have the freedom to select the specific columns you wish to display. Each column is visually distinguished by a color-coded scheme, with a deep orange or red shade representing higher resource utilization.
Clicking on a column allows you to sort the data based on that specific category. For instance, clicking on the CPU column will display the running processes sorted by CPU usage, with the most resource-intensive processes at the top. The top of the column also provides an overview of the total resource usage of all processes on your system. Furthermore, you can rearrange columns by dragging and dropping them. The available columns include:
Type: The process's category, which can be App, Background process, or Windows process.
Process ID (PID) is the numerical identifier assigned by Windows to a process. This identifier is used by certain functions and system utilities. Each time a program starts, Windows assigns a unique process ID, which helps in distinguishing between multiple instances of the same program that are running.
Process Name is the name of the file associated with a process. For instance, the file name for File Explorer is explorer.exe, Microsoft Word is WINWORD.EXE, and the Task Manager itself is Taskmgr.exe.
Command Line: This displays the complete command line utilized to initiate the process. It includes the entire path to the process's .exe file (e.g., "C:\WINDOWS\Explorer.EXE") along with any command-line options employed to start the program.
CPU: The process's CPU utilization, presented as a percentage of the overall available CPU resources.
Memory usage: This indicates the current amount of your system's physical working memory being utilized by the process. The memory usage is showcased in either MB or GB.
Disk activity: This illustrates the level of disk activity generated by the process, presented as MB/s. If the process is not actively reading from or writing to the disk, the display will show 0 MB/s.
Network: The current primary network exhibits the network usage of a process, presented in Mbps.
GPU: A process utilizes a certain percentage of the available resources of the GPU (graphics processing unit), expressed as a proportion.
GPU Engine: The GPU device and engine utilized by a process. In case you have multiple GPUs in your system, this will indicate the specific GPU being used by a process. Refer to the Performance tab to determine the association between the numbers ("GPU 0" or "GPU 1") and the physical GPUs.
Power Usage: The estimated power consumption of a process, taking into consideration its current CPU, disk, and GPU activity. For instance, it may display "Very low" if a process is not utilizing many resources or "Very high" if a process is utilizing a significant amount of resources. If the power usage is high, it signifies increased electricity consumption, potentially reducing the battery life of your laptop.
Power Usage Trend: This column displays the estimated impact on power usage over time. While the Power Usage column only indicates the current power usage, the Power Usage Trend column tracks the power usage progression. For instance, if a program occasionally consumes a substantial amount of power but is currently utilizing minimal power, it may display "Very low" in the power usage column and "High" or "Moderate" in the Power Usage Trend column.
By right-clicking on the headings, you will encounter a "Resource Values" menu. This menu is identical to the option that appears when you right-click on an individual process. Whether you access this option through right-clicking an individual process or the headings, it will consistently affect the appearance of all processes in the list.
In the Task Manager's menu bar, you will find a few convenient options:
- File > Run New Task: This allows you to launch a program, folder, document, or network resource by providing its address. Additionally, you can choose to launch the program as an Administrator by selecting the option "Create this task with administrative privileges."
Options > Always on Top: Enabling this option will ensure that the Task Manager window remains on top of all other windows at all times.
Options > Minimize on Use: Whenever you right-click a process and select "Switch To," the Task Manager will automatically minimize. Despite its peculiar name, this option only serves this purpose.
When you enable the "Hide When Minimized" option, the Task Manager will remain active in the notification area (system tray) even after you click the minimize button.
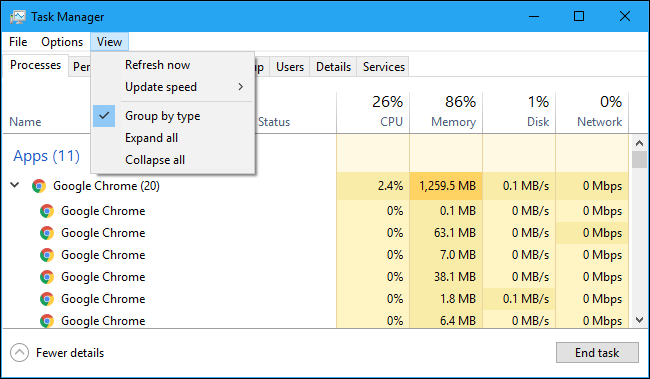
To instantly update the information shown in the Task Manager, select "Refresh Now" under the View menu.
View > Update Speed: Select the desired frequency for data updates in the Task Manager: High, Medium, Low, or Paused. If you choose Paused, the data will only update when you switch to a higher frequency or click "Refresh Now."
View > Group By Type: When enabled, this option categorizes processes on the Processes tab into three groups: Apps, Background Processes, and Windows Processes. When disabled, all processes are shown together in the list.
To expand all the process groups in the list, go to View and select Expand All. This will show all the process groups, including those of Google Chrome which are combined into a single "Google Chrome" group. You can also expand individual process groups by clicking the arrow to the left of their name.
To collapse all the process groups in the list, go to View and choose Collapse All. This will display all the Google Chrome processes under the designated Google Chrome category.
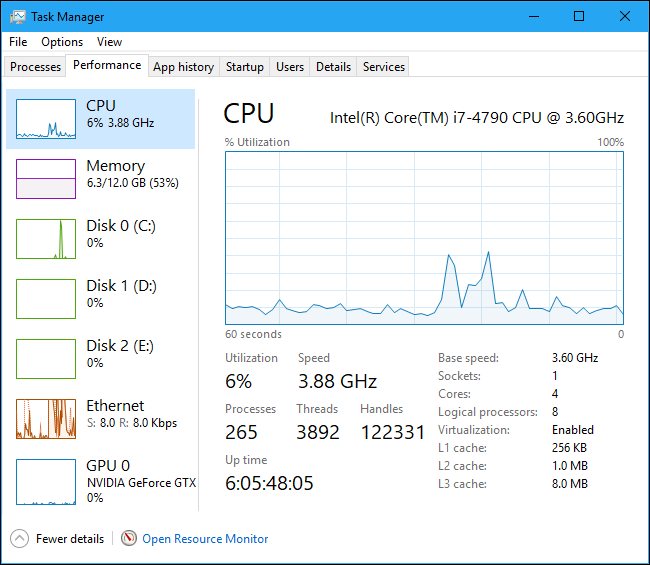
Viewing Performance Information
The Performance tab provides real-time graphs that display the utilization of various system resources including CPU, memory, disk, network, and GPU. If there are multiple disks, network devices, or GPUs, they can be viewed individually.
In the left pane, there are compact graphs, and by selecting an option, you can view a larger graph in the right pane. These graphs illustrate the usage of system resources in the past 60 seconds.
RAM: Determine the amount of RAM installed, its speed, and the quantity of RAM slots occupied on your motherboard. Additionally, you can review the portion of memory currently allocated for cached data, referred to as "standby" in Windows. This data remains readily available if required by your system, while Windows will automatically clear the cached data to create additional memory space for other tasks if necessary.
Disk: Identify the name, model number, capacity, as well as the present read and write speeds of your disk drive.
Network Adapter: In Windows, you can view the name of a network adapter and its corresponding IP addresses (both IPv4 and IPv6 addresses). Additionally, for Wi-Fi connections, the current connection's Wi-Fi standard is displayed, such as 802.11ac.
Graphics Processing Unit (GPU): The GPU section displays separate graphs for different types of activities, such as 3D rendering, video encoding, and decoding. It also provides information on the GPU's dedicated memory usage. Furthermore, you can identify the GPU's name, model number, and the version of the graphics driver it is currently using. Conveniently, Task Manager allows you to monitor GPU usage without the need for any third-party software.
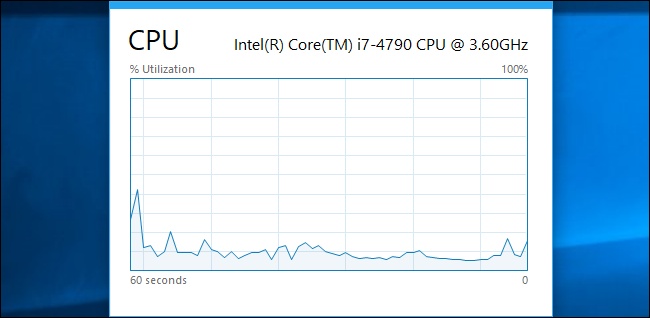
To keep the graph visible on your screen at all times, you have the option to resize it into a smaller window. Simply double-click anywhere within the empty white space in the right pane, and a floating window will appear with the graph that stays on top of other windows. If you prefer a summarized view of the graph, you can right-click on it and choose "Graph Summary View" to activate this mode.
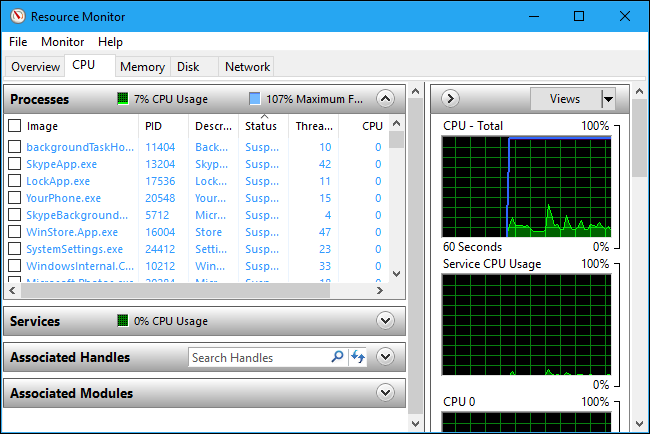
The Resource Monitor tool can be accessed by clicking on the "Open Resource Monitor" button located at the bottom of the window. This tool offers a comprehensive overview of the GPU, memory, disk, and network usage for each individual running process, presenting users with more detailed information.
Consulting App History
The App History tab is exclusive to Universal Windows Platform (UWP) apps and does not display data for traditional Windows desktop apps, making it less valuable for most users.
At the top of the window, you will find the date when Windows began collecting resource usage data. The list presents UWP applications along with the corresponding CPU time and network activity generated by each application from that date onwards. By right-clicking on the headings, additional options related to network activity can be enabled to provide more in-depth insights.
Metered Network: The content transferred over networks with limited data can be managed by setting them as metered. This is particularly useful for networks like mobile networks used for tethering, where data usage needs to be conserved.
Tile Updates: The program downloads a certain amount of data to enable the display of live tile updates on Windows 10's Start menu.
Non-metered Network: The amount of data transferred over non-metered networks.
Downloads: The amount of data downloaded by the program on all networks.
Uploads: The amount of data uploaded by the program on all networks.
Controlling Startup Applications
Windows 10's Startup tab serves as a convenient built-in manager for your startup programs. It provides an overview of all the applications that are set to automatically launch when you log into your user account. You'll find a comprehensive collection of programs that reside in your Startup folder, as well as those specified to initiate via the Windows registry.
To disable a startup program, simply right-click on it and choose "Disable" or select the program and click on the "Disable" button. To re-enable it, click on the "Enable" option that will appear instead. Another option is to access the Settings > Apps > Startup interface for managing startup programs.
On certain systems, you may notice a "Last BIOS time" displayed at the top right corner of the window. This indicates the amount of time it took for your BIOS (or UEFI firmware) to initialize the hardware during your last PC boot. Please note that not all systems will show this information. If your PC's BIOS does not report this time to Windows, you will not see it.
As usual, you can right-click the headings and enable additional columns. The columns are:
Name: The name of the program.
Startup Impact: It is an assessment of the CPU and disk resources utilized by the program during startup. Windows monitors and records this data in the background. A program with minimal resource consumption will be classified as "Low," while a program with significant resource usage will be categorized as "High." For disabled programs, the classification will be "None." Disabling programs with a "High" startup impact will contribute more to boosting the boot process compared to disabling those with a "Low" impact.
Startup Type: This indicates whether the program initiates due to a registry entry ("Registry") or being present in your startup folder ("Folder.")
Startup Disk I/O: This metric represents the amount of disk activity performed by the program during startup, measured and recorded by Windows for each boot.
Startup CPU: This metric indicates the amount of CPU time utilized by the program during startup, measured in milliseconds and recorded by Windows at boot.
Running: This indicates if a startup program is currently active. If this column is blank, it means the program has terminated on its own or you have manually closed it.
Disabled Time: The date and time when you disabled a startup program will be displayed here.
Command Line: This shows the full command line the startup program launches with, including any command line options.
Checking on Users
The Users tab presents a comprehensive listing of currently logged-in users and their corresponding running processes. In the event that you are the sole individual signed into your Windows PC, only your user account will be visible in this section. However, if other users have signed in and left their sessions locked without signing out, you will also be able to view them as "Disconnected" sessions. Furthermore, this feature provides a clear snapshot of the CPU, memory, disk, network, and various other system resources utilized by the processes running under each specific Windows user account.
To disconnect a user account, right-click on it and choose "Disconnect." Alternatively, you can right-click on it and select "Sign Off" to force a sign off. The Disconnect option will end the desktop connection while allowing the programs to continue running, and the user can log back in later, similar to locking a desktop session. On the other hand, the Sign Off option will terminate all processes, akin to signing out of Windows. Additionally, from here, you have the ability to manage processes of another user account if you wish to end a task associated with it.
Session: Indicates the nature of the current session. "Console" is displayed for sessions accessed on the local system, making it particularly relevant for server systems utilizing remote desktops.
Client Name: Refers to the name of the remote client system that is accessing the session, in the case of remote access.
Status: The status of the session — for example, if a user's session is locked, the Status will say "Disconnected."
CPU: Total CPU used by the user's processes.
Memory: Total memory used by the user's processes.
Disk: Total disk activity associated with the user's processes.
Network: Total network activity from the user's processes.
Managing Detailed Processes
This is the Task Manager pane that offers the most comprehensive details. It resembles the Processes tab, but provides additional information and showcases processes from all user accounts on your system. If you are familiar with the Windows 7 Task Manager, you will find this interface highly recognizable as it displays the same information as the Processes tab in Windows 7.
You can right-click processes here to access additional options:
End task: End the process. This is the same option found on the normal Processes tab.
End process tree: Terminate the process and all its child processes.
Set priority: Assign a priority level to the process, which can be Low, Below normal, Normal, Above normal, High, or Realtime. The default priority for processes is Normal. Lower priority levels are suitable for background processes, while higher priority levels are preferable for desktop processes. It is important to note that Microsoft advises against altering the Realtime priority.
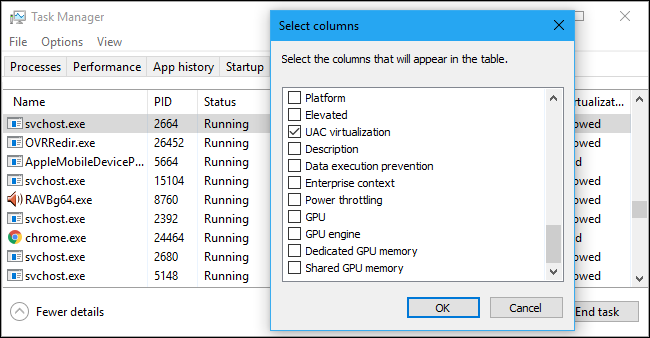
UAC virtualization: Toggle the User Account Control virtualization to enable or disable it for a specific process. This functionality resolves issues with applications that depend on administrator privileges by virtualizing their interaction with system files and redirecting their file and registry access to alternative directories. Primarily utilized by older programs, such as those designed for Windows XP, that were not adapted for contemporary Windows versions. This feature is mainly intended for developers for debugging purposes and typically does not require modification.
Create dump file: Capture and save a snapshot of the program's memory onto the disk. This utility serves as a valuable debugging tool for programmers.
Open file location: Open a File Explorer window showing the process's executable file.
Search online: Perform a Bing search for the name of the process.
View the properties window of the .exe file associated with the process.
Navigate to the Services tab to display the services linked to the process. This feature is especially beneficial for svchost.exe processes, as the associated services will be emphasized.
By right-clicking on the headings and choosing "Show Columns," you can access an extensive range of information that can be displayed here. This includes numerous options that are not currently accessible on the Processes tab.
Column Description:
Package Name: This indicates the name of the app package associated with the process, specifically for Universal Windows Platform (UWP) apps. In the case of other apps, this column remains blank. UWP apps are typically distributed through the Microsoft Store.
Process ID (PID) is a unique identifier assigned to a specific process. It is important to note that the PID is associated with the process itself, not the program. Therefore, if a program is closed and reopened, the subsequent process will have a different PID.
The status of a process indicates whether it is currently running or suspended to conserve power. In the case of Windows 10, UWP apps are automatically "suspended" when not in use to optimize system resources. Additionally, users have the ability to control whether traditional desktop processes are suspended by Windows 10.
Job Object ID: The "job object in which the process is currently executing." Job objects serve as a means to cluster processes together for efficient management as a unified entity.
CPU: The current utilization percentage of CPU resources by the process across all available CPUs. If there are no other processes utilizing CPU time, Windows will display the System Idle Process as the primary consumer. In simpler terms, if the System Idle Process occupies 90% of your CPU resources, it indicates that the remaining processes on your system collectively utilize only 10%, while the CPU was idle for 90% of the time.
CPU time refers to the cumulative amount of time (in seconds) that a process has utilized the processor since it started running. This value is reset if the process is closed and then restarted. It is a useful metric for identifying processes that may have high CPU usage but are currently inactive.
Cycle, on the other hand, represents the portion of CPU cycles that the process is currently utilizing across all CPUs. The distinction between Cycle and the CPU column is not clearly explained in Microsoft's documentation. However, the values in this column generally align closely with those in the CPU column, suggesting that they provide similar information but are measured in a different way.
Working set (memory): The amount of physical memory the process is currently using.
Peak working set (memory): The maximum amount of physical memory the process has used.
Working set delta refers to the difference in working set memory since the previous data refresh.
Active private working set memory represents the amount of physical memory utilized by the process that is not available for use by other processes. In order to optimize RAM usage, processes often cache certain data, but they can promptly release this memory if required by another process. This column does not take into account data from suspended UWP processes.
Working Set (Private Memory): The quantity of physical memory utilized by the process, which is exclusive to other processes. This column includes data from suspended UWP processes.
Working Set (Shared Memory): The quantity of physical memory used by the process that can be shared with other processes when required.
Commit size refers to the virtual memory that is allocated by Windows for the process.
Paged pool represents the kernel memory allocated by the Windows kernel or drivers for this process, which can be transferred to the paging file when required.
Page Fault Delta: The difference in the number of page faults since the last update.
Initial Priority: The priority assigned to a process, such as Low, Normal, or High. Windows gives preference to scheduling processes with higher priorities. For instance, non-essential system background tasks may have a lower priority compared to desktop program processes.
The process's object table currently contains a count of handles. These handles symbolize system resources such as files, registry keys, and threads.
A process consists of a certain number of active threads. Windows assigns processor time to these threads. Additionally, threads within a process share memory.
The process utilizes a certain count of "window manager objects" which comprise windows, menus, and cursors. Additionally, it utilizes a specific number of Graphics Device Interface (GDI) objects, responsible for drawing the user interface.
I/O reads: The count of read operations executed by the process since its initiation. I/O refers to Input/Output and encompasses file, network, and device input/output.
I/O writes: The count of write operations carried out by the process since its initiation.
Non-read and non-write operations performed by the process since its initiation, such as control functions, fall under the category of I/O other.
The total number of bytes read by the process since its initiation is tracked under I/O read bytes.
Bytes written: The cumulative count of bytes written by the process from the beginning till now.
Other I/O bytes: The overall count of bytes utilized in I/O operations other than reading and writing since the process initiation.
The program's compatibility with the minimum operating system can be determined from the information included in its manifest file. This can include details such as "Windows Vista," "Windows 7," or "Windows 8.1". Some applications may not display any information in this column.
The platform of the process can be either 32-bit or 64-bit.
Elevated: Indicate whether the process is operating in elevated mode, i.e., with Administrator permissions. Each process will be labeled as either "No" or "Yes".
UAC virtualization: Determine whether User Account Control virtualization is enabled for the process. This feature allows programs designed for older versions of Windows to run without requiring Administrator access by virtualizing the program's access to the registry and file system. The options include Enabled, Disabled, and Not Allowed (for processes that necessitate system access).
Process Description: A human-readable description is provided for the process through its .exe file. For instance, the description for chrome.exe is "Google Chrome," and for explorer.exe, it is "Windows Explorer." This description is also displayed in the Name column of the Processes tab.
Data Execution Prevention: The process's status with regards to Data Execution Prevention (DEP) is mentioned. DEP is a security feature that aids in safeguarding applications against attacks.
Enterprise context: The app's enterprise context indicates whether it operates within an enterprise domain with access to enterprise resources, a "Personal" context without access to work resources, or "Exempt" for Windows system processes.
Power throttling: This feature determines whether power throttling is active or deactivated for a particular process. Windows automatically adjusts the performance of specific applications when they are not in use to conserve battery power. You can manage which applications are subject to power throttling through the Settings app.
GPU: The process's GPU resource utilization percentage indicates the highest usage across all GPU engines.
GPU engine: The GPU engine utilized by the process indicates the one used the most. To view the list of GPUs and their engines, refer to the GPU information on the Performance tab. Even if there is only one GPU, it typically has separate engines for tasks such as 3D rendering, video encoding, and video decoding.
Dedicated GPU memory refers to the aggregate amount of GPU memory being utilized by the process across all GPUs. Discrete GPUs possess their own dedicated video memory, whereas onboard GPUs rely on a reserved fraction of the system memory.
On the other hand, shared GPU memory pertains to the collective amount of system memory that is being utilized by the process in conjunction with the GPU. This pertains to data stored in the regular RAM of your system that is shared with the GPU, as opposed to data stored in the dedicated memory of the GPU itself.
Working With Services
The columns in the Service pane are as follows:
Name: A short name associated with the service
PID: The process identifier number of the process associated with the service.
Description: A longer name that provides more information about what the service does.
Status: Whether the service is "Stopped" or "Running."
Group: If applicable, the service is categorized into a specific group. During startup, Windows loads one service group at a time. A service group refers to a collection of similar services that are loaded together.
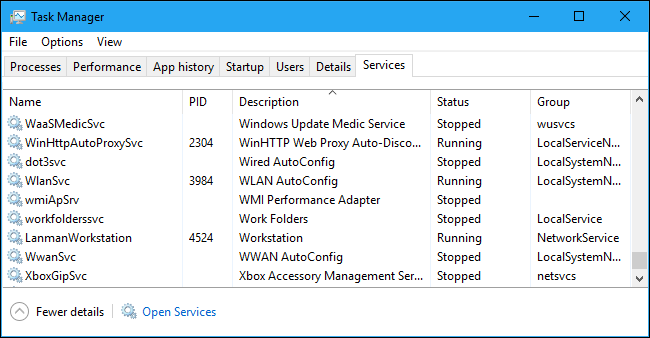
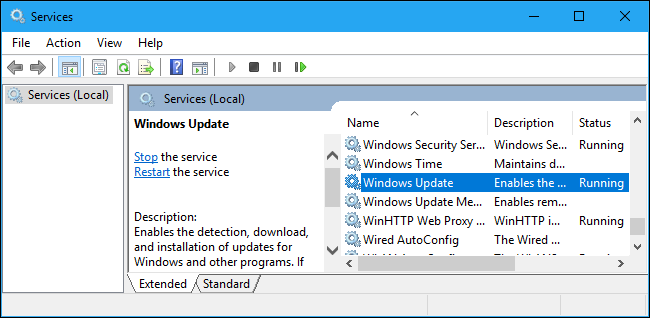
For additional details regarding these services, simply click on the "Open Services" link located at the lower section of the window. Nevertheless, it's important to note that this Task Manager pane only serves as a slightly less robust tool for managing services.
Process Explorer: A More Powerful Task Manager
If you find the built-in Windows Task Manager lacking in power, we suggest trying out Process Explorer. This application, provided free by Microsoft, is a valuable addition to the suite of SysInternals system tools.